Best IT Infrastructure Monitoring Tools
Whenever managing a complex IT environment poses a burden of continuous oversight – implementing infrastructure monitoring is a solution. The live supervision it offers aims to maintain performance, ensure security and maximize resource efficiency. The article will reveal how those are attained with the help of monitoring tools that provide real-time visibility, automated alerts, and actionable insights.
The blog discusses:
- what is an infrastructure monitoring tool
- best tools to check
- the main features to consider
- how to choose the monitoring software

Table of Contents
Organizations operate a range of interconnected servers, networks, applications, and cloud platforms, and are often faced with challenges caused by the high levels of complexity that come with managing such diverse environments. This makes it crucial to establish constant supervision. The optimal solution is introduced by infrastructure monitoring, a set of techniques and tools that guarantees continuous supervision, and helps maintain system health, performance, resource usage, and security.
The lack of proactive monitoring will directly lead to lower productivity and dissatisfaction among users since performance errors will only be addressed after having disrupted workflows. Instead of simply reacting to issues, infrastructure monitoring provides a proactive approach: by ensuring real-time visibility, automated alerts, and actionable insights, it helps teams detect failures promptly and manage them without hindering the working process.
Table of Contents
What are IT Infrastructure Monitoring Tools
IT infrastructure monitoring tools represent a set of software solutions that monitor, analyze, and manage the health, performance, and security of an organization’s IT environment. Their main objective is to identify issues and secure productivity by delivering real-time insights into servers, networks, storage, applications, and cloud services so that proactive measures can prevent undesirable outcomes.
What makes infrastructure monitoring tools indispensable for system performance assurance is the wide range of capabilities and the operational advantages they provide, including the following:
- bottleneck identification;
- resource utilization improvement;
- slowdown prevention;
- security enhancement by detecting unauthorized access, monitoring vulnerabilities, and protecting sensitive data;
- compliance support by ensuring adherence to regulatory requirements and reducing legal risks.
The main advantage of the infrastructure monitoring tools is their ability to ensure automated monitoring and continuous visibility, capabilities essential for system reliability, security, and overall business continuity.
Best IT Infrastructure Monitoring Tools Reviewed
Server and network monitoring tools are primarily developed to maintain productivity and reliability in system performance and alert your DevOps support when issues occur, accompanied by such benefits as maximized uptime and improved disaster recovery plans. While all the tools have certain things in common, they still are different when it comes to levels of performance. In this section, we will focus on the leading tools in the industry.
Zabbix
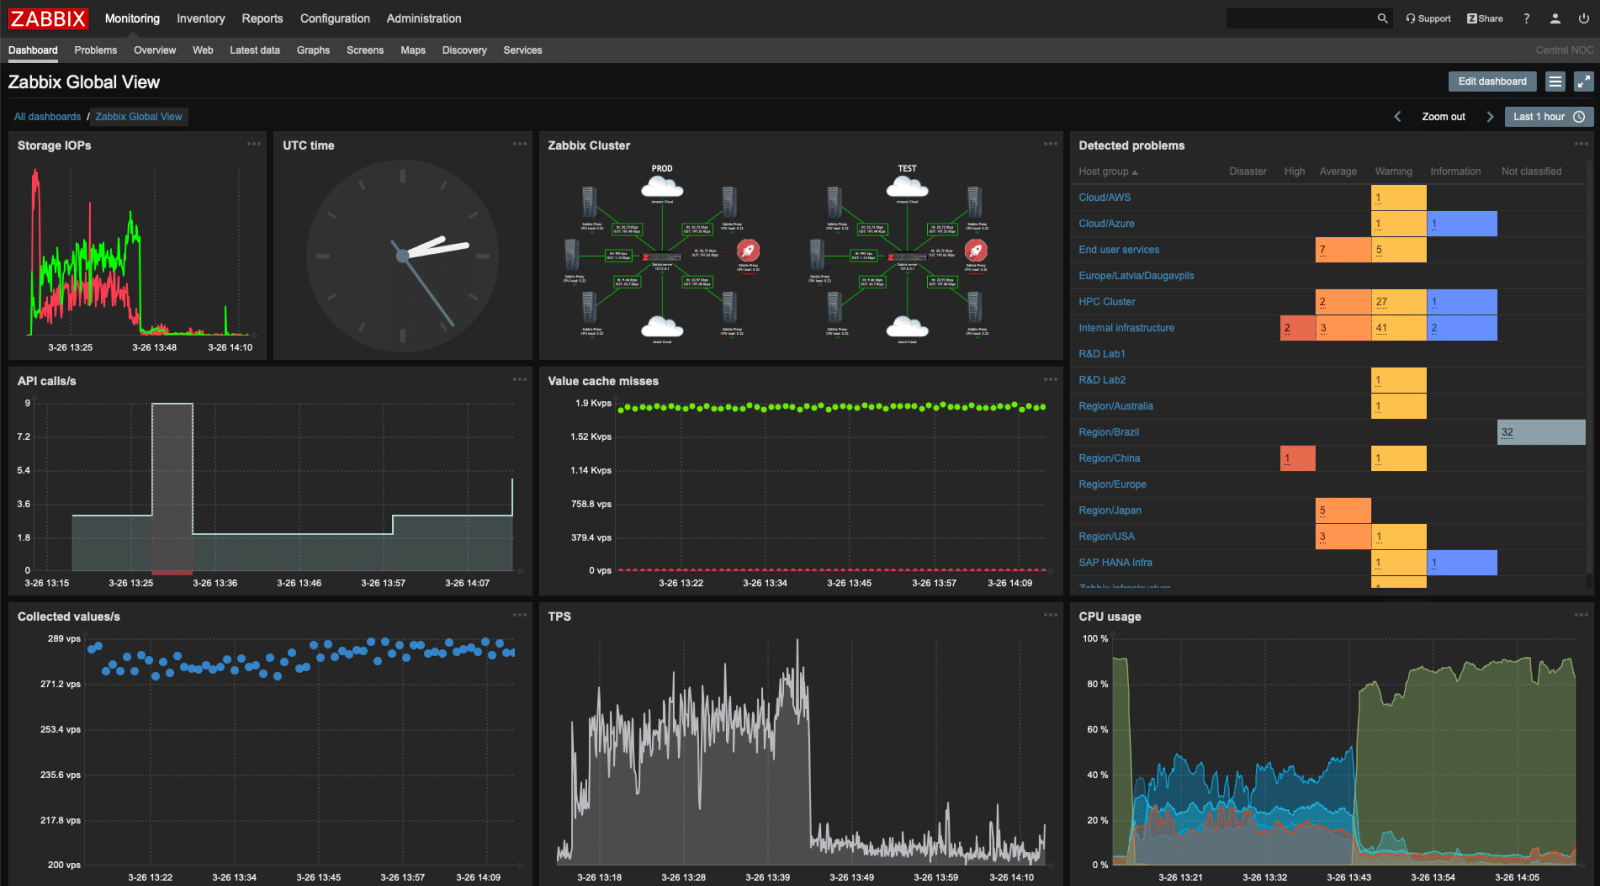
The first solution we will be looking into is Zabbix, a comprehensive, open-source infrastructure monitoring tool that provides centralized monitoring for servers, network devices, and virtual machines. It also tracks the health, performance, and availability of IT systems across large and complex environments. Zabbix’s notable ability is to provide IT teams with comprehensive visibility into critical infrastructure components and provide constant supervision. A combination of those contributes to optimal resource utilization, minimizing downtime, and proactive issue resolution.
Zabbix includes a range of key features, such as:
- Built-in Java application server monitoring
- Hardware and virtual machine monitoring
- Host health monitoring
- Integrated installation with alerting, ticketing, IoT, and ITSM
- Visual topology map
Here are the core upsides of using Zabbix:
- Comprehensive infrastructure monitoring.
By providing access to a unified view of network health, server availability, traffic patterns, and performance metrics, Zabbix ensures centralized and efficient monitoring across the system. - Proactive issue resolution.
The tool delivers real-time alerts for resource overuse or system failures that enable IT teams to manage issues before they hinder the workflows. - Scalability and customization.
Zabbix is suitable for businesses of any size, ranging from small networks to large, complex infrastructures. It also provides customizable dashboards and alert thresholds that could be altered to meet the specific needs of any organization. - Financial efficiency.
Zabbix is an open-source tool, which means that it doesn’t require licensing fees that usually come with commercial monitoring solutions.
Prometheus
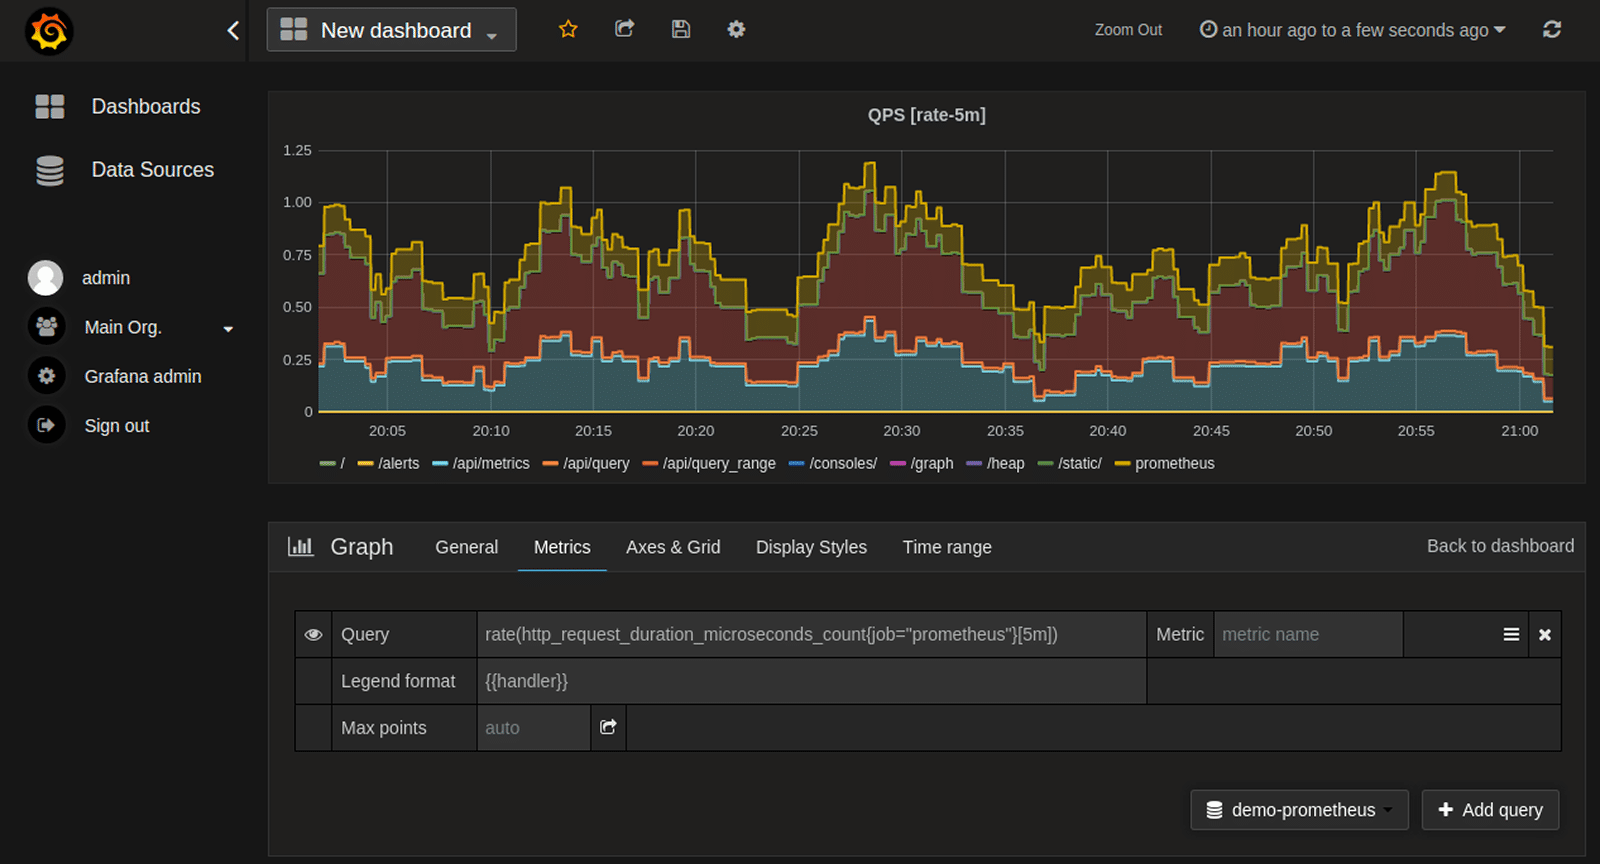
Another example of an open-source monitoring and alerting tool utilized for data collection and analysis is Prometheus. While it was originally developed by SoundCloud and later adopted by the Cloud Native Computing Foundation (CNCF), now this open-source tool is actively used for monitoring cloud-native environments and Kubernetes infrastructures. The operational process of Prometheus proceeds as follows: it collects metrics from monitored targets via HTTP, stores them in a local time-series database, and enables powerful querying with PromQL. Prometheus dynamically discovers targets for monitoring, integrates with exporters for non-native metrics, and offers alerting via Alertmanager. When integrated with Grafana, Prometheus provides custom dashboards for real-time infrastructure visibility. This collaboration is what further enhances the monitoring capabilities and makes Prometheus a highly scalable and efficient monitoring solution.
Prometheus is equipped with a set of characteristics, namely:
- Time-series data collection
- Flexible querying with PromQL
- Exporters for non-native integrations
- Service discovery
- Pushgateway for short-lived services
- Built-in alerting with an alert manager
- Integration with Grafana
The primary advantages of Prometheus include:
- Versatile architecture support.
This tool is adaptable to various IT environments and can be seamlessly integrated with both machine-centric and service-oriented architectures. - Performance during outages.
Prometheus is highly functional when it comes to issue detection, which allows teams to promptly detect errors and minimize downtime. - Standalone functionality.
With each of the Prometheus servers operating independently, the level of accessibility remains stable even during failures, without reliance on external storage or services. - Cloud-native workload optimization.
Prometheus is capable of streamlined integration with Kubernetes and other modern infrastructures, which makes it a perfect tool for containerized environments.
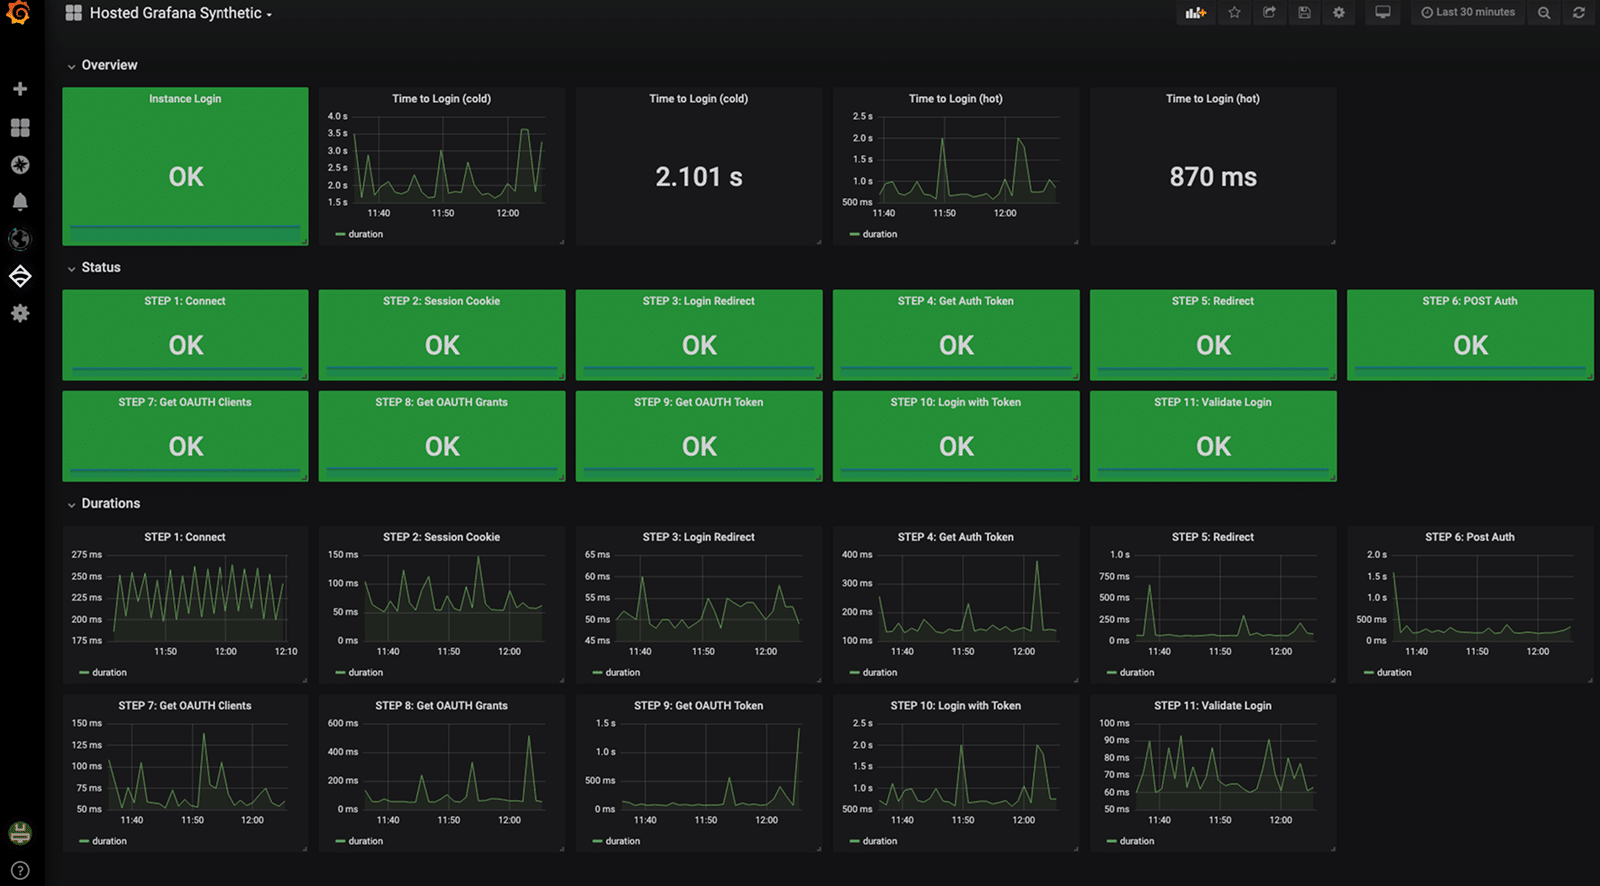
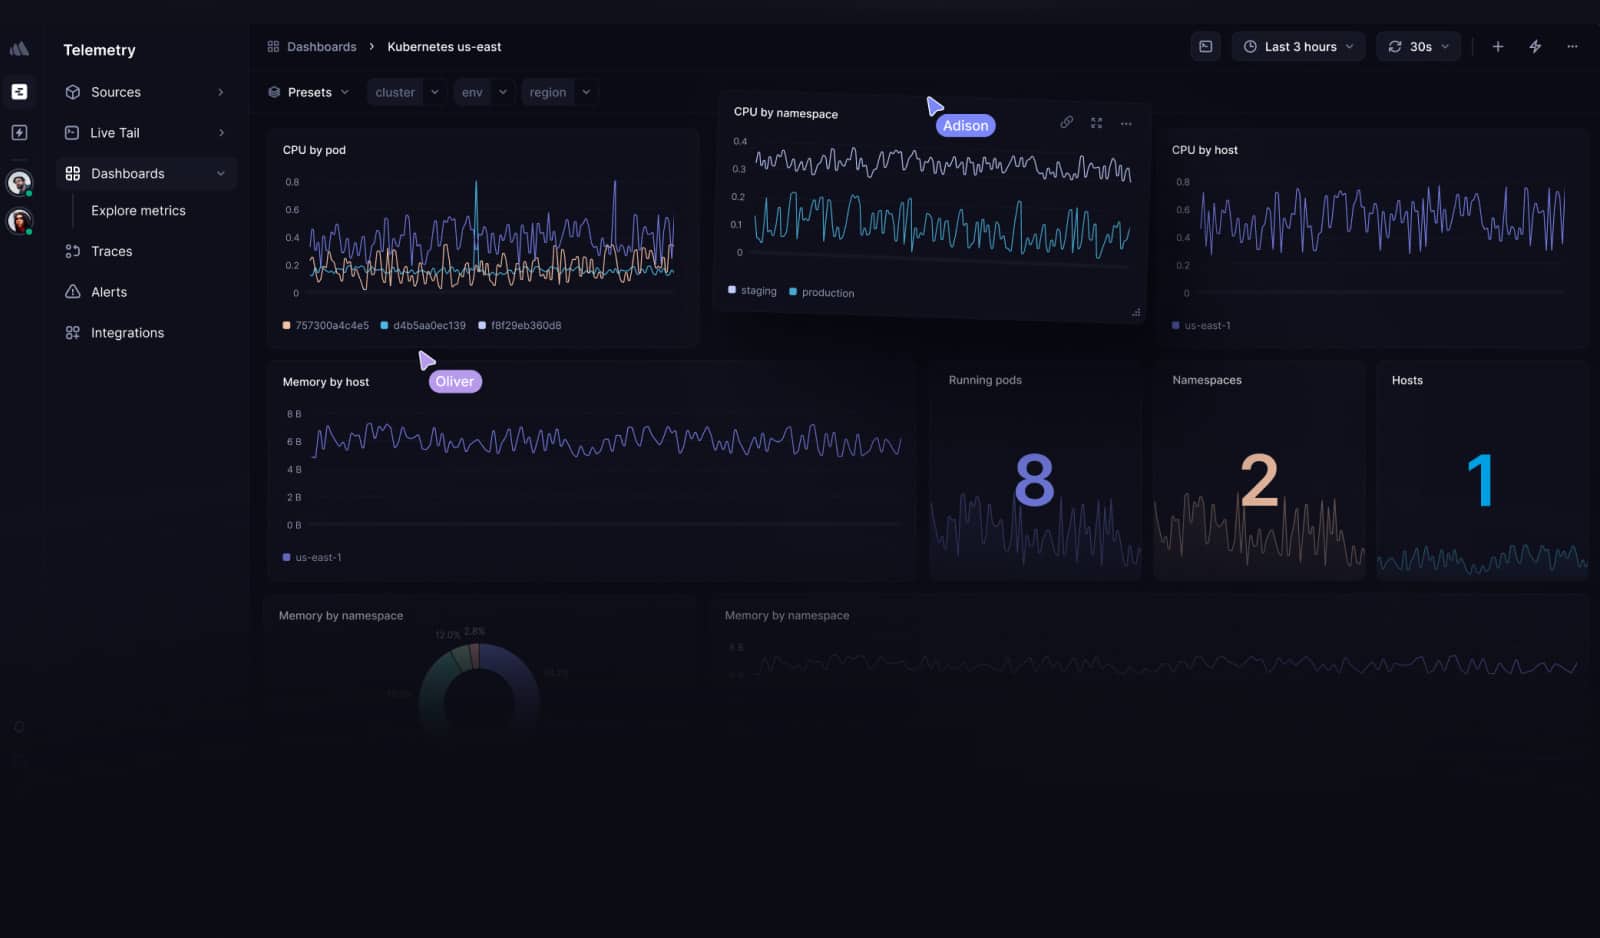
Grafana
The next solution is mainly characterized by its seamless integration with such platforms as Prometheus, Graphite, InfluxDB, MySQL, PostgreSQL, and Elasticsearch, and its ability to transform time-series data into interactive dashboards. Loaded with those functions, Grafana provides comprehensive visualization and allows for a centralized view of multi-cloud environments, Kubernetes clusters, and system performance. With its primary goal being infrastructure observability, Grafana is a valuable tool when it comes to trend analysis, anomaly detection, and efficient troubleshooting.
Grafana is defined by the following characteristics:
- Time-series data visualization
- Customizable dashboards
- Multi-cloud observability
- Kubernetes monitoring
- Seamless integrations
- Advanced alerting
Here are some benefits of using Grafana:
- Enhanced observability with visual insights.
Grafana offers a comprehensive view of system health and allows teams to promptly identify trends and anomalies. - Flexibility and expansion.
This tool supports diverse data sources and plugins and can adapt to different monitoring needs. - Fast setup and minimal management overhead.
Its ability to smoothly integrate with monitoring solutions (e.g., Prometheus) considerably reduces configuration complexity. - Hybrid and cloud-native environment optimization.
Grafana ensures scalability by supporting multi-cloud, containerized applications, and on-prem monitoring. - Troubleshooting improvement and MTTR reduction.
This tool combines logs, traces, and metrics in a single, easy-to-navigate interface, which significantly simplifies issue resolution.
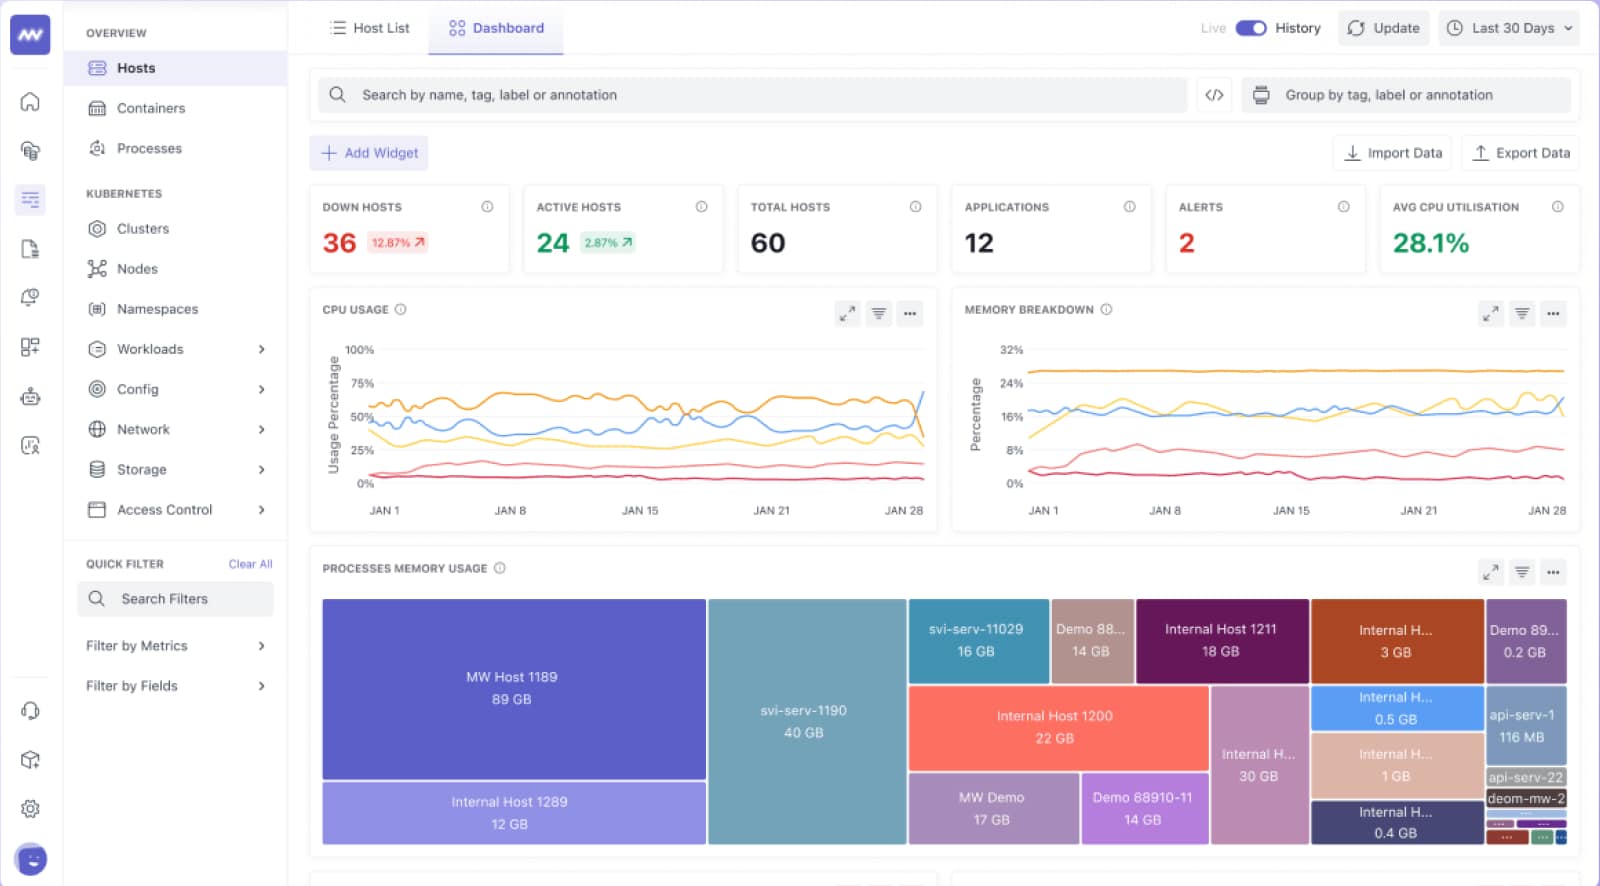
Middleware
Middleware is a full-stack observability platform that provides unified visibility across metrics, logs, traces, and events. It supports real-time monitoring and troubleshooting for infrastructure and applications in cloud-native and hybrid environments. By automating log data collection across distributed systems, it helps teams detect and address operational and security issues. Features like AI-powered anomaly detection and customizable dashboards support proactive incident management and more efficient resource utilization.
Middleware functionality is driven by these major elements:
- Real-time infrastructure insights
- Centralized log analysis
- App performance tracking
- Simulated user testing
- Database performance checks
- Real user experience
Middleware provides an array of advantages, including:
- Comprehensive Visibility.
By consolidating telemetry data—in the form of logs, metrics, traces, and events—Middleware gives a complete picture of system performance, allowing for quicker and better-informed decision-making. - Proactive Issue Resolution.
The platform’s AI-driven insights enable proactive identification and resolution of anomalies, minimizing downtime and enhancing system dependability. - Seamless Integration.
With more than 200 integrations supported, Middleware integrates seamlessly with numerous tools and services, streamlining intricate workflows and boosting overall productivity. - Dashboard.
Offers dynamic and interactive dashboards that enable teams to visualize and analyze data that caters to their individual requirements. - Scalability and Performance.
Built to interact with dynamic, high-scale environments through light-weight agents, minimizing the overhead in performance.
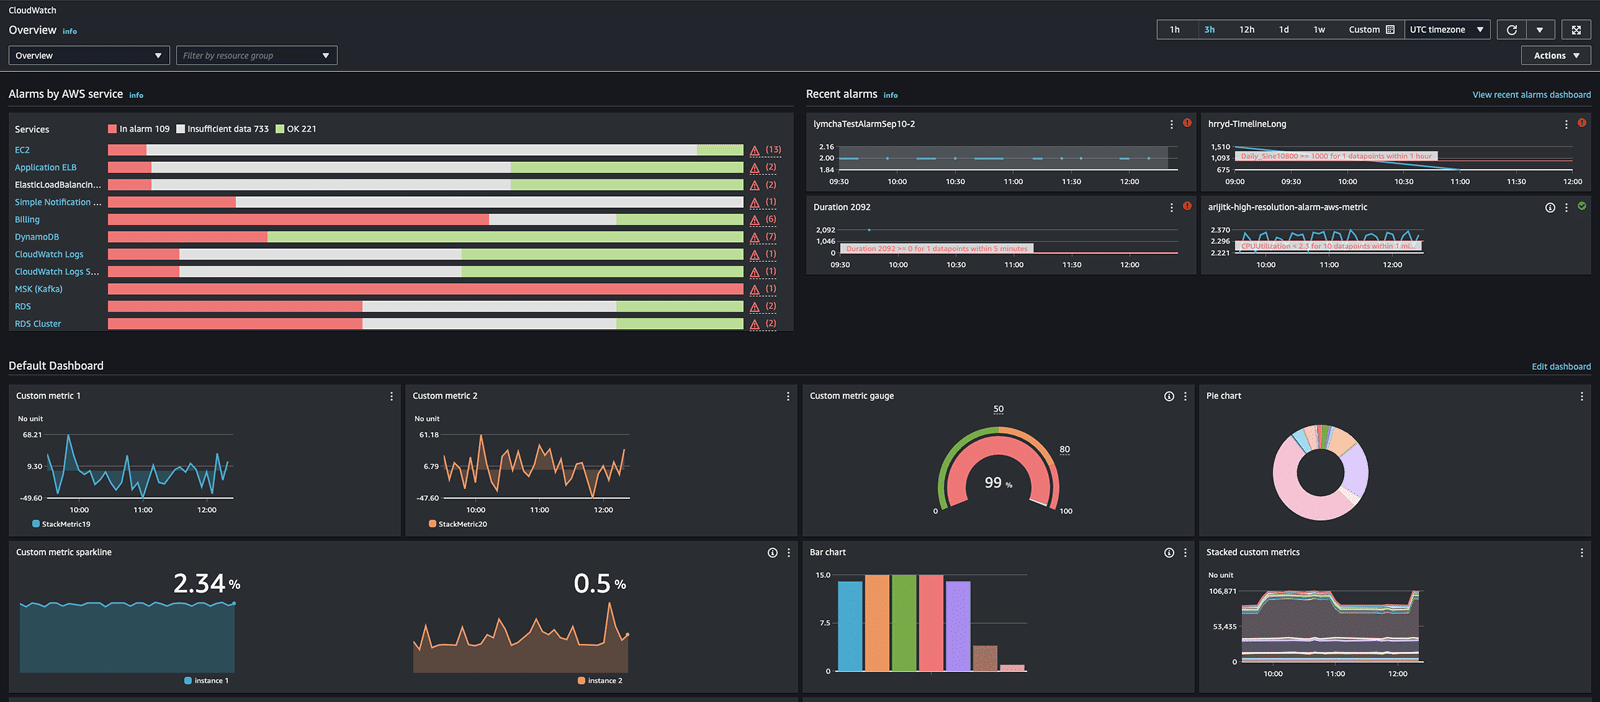
Amazon CloudWatch
Amazon CloudWatch, a fully managed observability solution, specializes in delivering real-time insights into infrastructure performance, application health, and operational efficiency. To be more precise, this tool allows IT teams to collect, visualize, and analyze logs, metrics, and events from both AWS and on-premises servers, and the derived data provides a unified view of the whole infrastructure. Because of these attributes, CloudWatch is considered a highly functional tool for issue detection and resolution, improved resource utilization, and automated responses to system events, specifically for organizations running workloads in AWS.
CloudWatch is characterized by the following:
- Real-time monitoring with metrics collection
- Configurable dashboards
- Cross-account observability
- Automated alarms and notifications
- AI-powered anomaly detection
- Database insights
- Synthetics and real user monitoring (RUM)
- Event-driven automation
CloudWatch boasts of the following:
- Seamless AWS integration.
CloudWatch is fully compatible with AWS services like EC2, Lambda, RDS, Auto Scaling, etc. - Unified hybrid cloud monitoring.
Its ability to integrate with both AWS and on-premises infrastructure ensures a comprehensive operational view. - Reduced alert fatigue.
This tool groups related alerts and allows teams to focus on critical issues instead of managing excessive notifications. - Automated scaling and optimization.
CloudWatch analyzes current demands and triggers AWS Auto Scaling to manage resources accordingly. - End-to-end observability.
This tool unifies logs, metrics, and traces in a single platform, which leads to minimized Mean Time to Resolution (MTTR) and more dynamic root cause analysis. - Cloud migration capability.
For businesses that are transitioning to AWS, CloudWatch can be used for real-time insights and seamless cloud operations.
Better Stack
One more powerful infrastructure monitoring tool is Better Stack, a modern, cross-functional platform for teams of all sizes, which integrates real-time observability, log management, and incident response into a single, scalable solution. Its capability for proactive monitoring, fast incident detection, and efficient troubleshooting for various systems (websites, applications, networks, and cloud environments) is complemented by cost-efficient pricing, seamless integrations, and advanced log analytics – all to make Better Stack a strong alternative to traditional monitoring solutions.
The functional strengths of Better Stack are introduced by:
- Comprehensive infrastructure monitoring
- Real-time incident management
- Smart log management with Logtai
- Pre-built and custom dashboards
- Flexible alerting with anomaly detection
- Incident communication with public status pages
- Seamless Grafana and OpenTelemetry integration
Better Stack offers a list of benefits that streamline infrastructure monitoring, including:
- Unlimited data retention.
By default, Better Stack offers up to 13 months of metrics storage without extra costs. - Radical cost control.
This tool sets billing alerts and spending limits to avoid unexpected expenses. - Collaborative incident resolution.
Better Stack provides a view of your colleagues’ activity in real time to boost troubleshooting. - Built-in on-call scheduling and escalations.
When issues occur, this tool automates response workflows for a quick resolution. - Easy deployment and fast integration.
Better Stack tool already has built-in connections to over 200 different platforms, so you can start monitoring promptly after implementation.
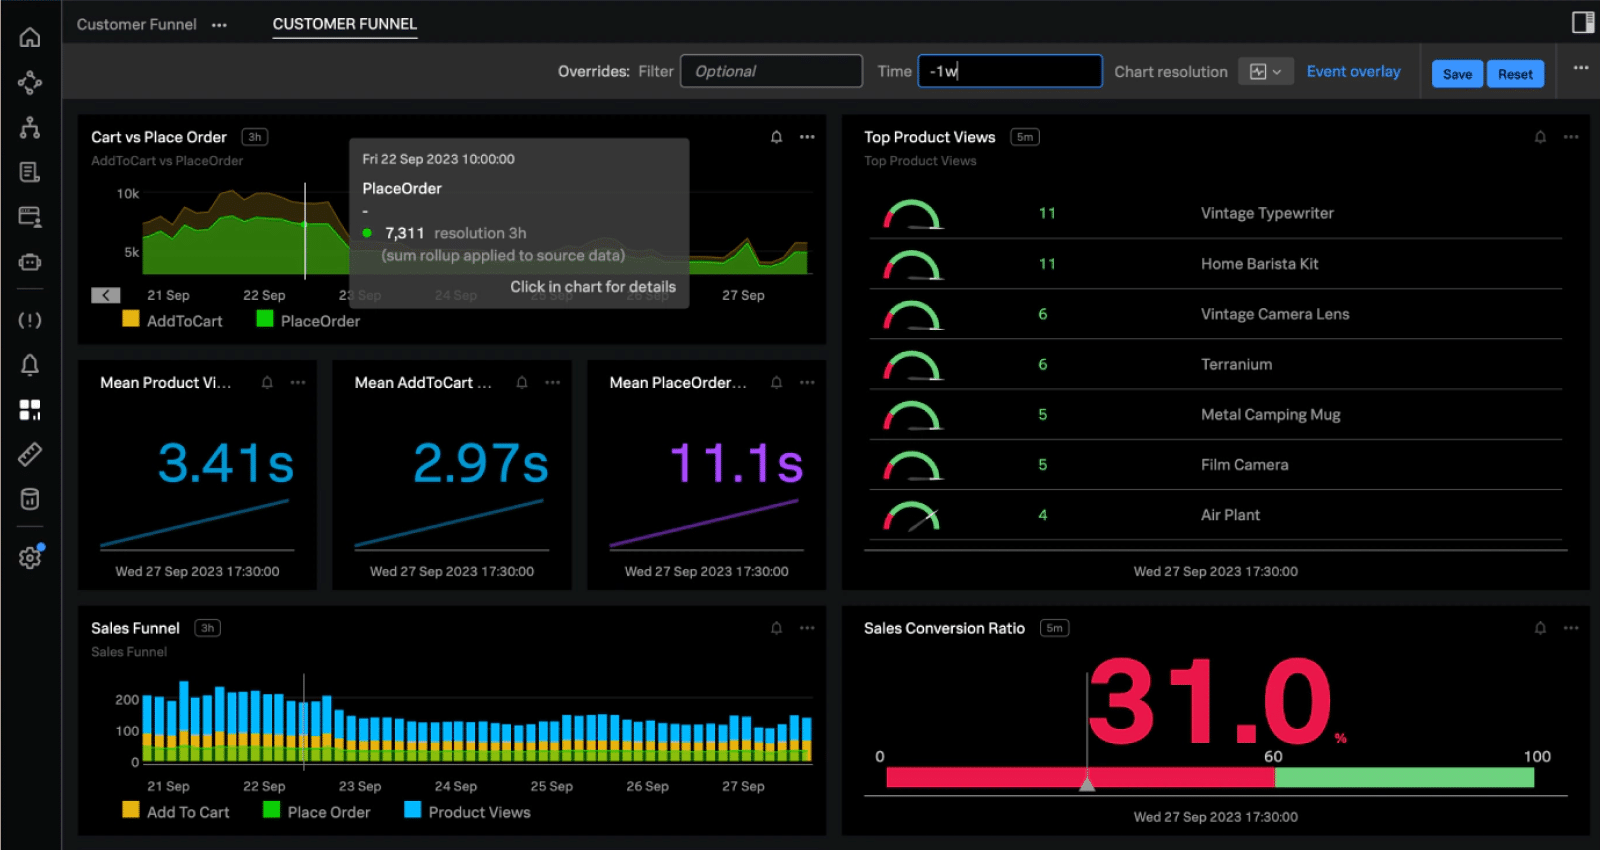
Splunk
Another observability solution on the radar is Splunk Infrastructure Monitoring (Splunk IM). Known for its versatility across various environments (high-scale cloud, on-prem, or hybrid environments) and adherence to the OpenTelemetry standards, it streames analytics engine, intelligent alerting, and automated root-cause analysis. These features make Splunk an effective tool that provides valuable operational insights into the system performance and allows DevOps, SREs, and IT teams to detect, diagnose, and resolve issues with maximum efficiency and minimum downtime.
Splunk offers a robust set of capabilities, namely:
- Real-time streaming analytics
- AI-powered alerts and adaptive thresholds
- Full-stack correlation
- Automatic cloud network visibility
- Kubernetes navigator
- Custom metrics for business KPIs
The range of Splunk IM assets encompasses:
- Real-time data processing.
Instead of waiting for scheduled reports, Splunk ingests and analyzes metrics in real time for instant visibility. - Vendor-agnostic and cloud-native attributes.
Splunk supports various platforms like AWS, Azure, GCP, and Kubernetes, as well as hybrid environments with no agents required. - High-cardinality data handling.
This tool aptly handles large-scale time-series data, which leads to faster search and analysis. - Adaptive alerting and noise reduction.
Splunk utilizes AI-driven alerts to reduce false positives and prioritize critical issues. - Comprehensive incident response.
This solution can be seamlessly integrated with Splunk On-Call and incident response tools for streamlining resolution workflows. - Seamless log and metric correlation.
Splunk configures logs, metrics, and traces into a single unified panel that enables faster root-cause analysis.
Datadog
As a monitoring and observability platform, Datalog is defined by its cloud-based nature and compatibility with hybrid and multi-cloud environments. Similarly to other monitoring tools, Datadog provides real-time visibility into IT infrastructure, applications, and network performance, though this tool stands out with its extensive platform of 850+ vendor-backed integrations to afford broader compatibility. Datadog efficiently does its bit by allowing teams to collect, analyze, and correlate metrics, logs, and traces for faster issue detection and resolution.
Datadog’s functionality is driven by these major elements:
- Live process and container monitoring
- AI-driven alerts and anomaly detection
- Host and container maps
- Serverless function monitoring
- Customizable dashboards
Datadog offers a lineup of benefits, encompassing:
- Fast and easy setup.
Datadog automatically discovers infrastructure and integrates with minimal configuration. - Full-stack observability.
Its ability to merge logs, metrics, and traces in one platform enables faster root-cause analysis. - Cloud and on-prem flexibility.
This tool is highly adaptable to AWS, Azure, GCP, Kubernetes, and on-prem environments. - Scalability and performance.
Datadog is characterized by its capability for integration with dynamic, high-scale environments with lightweight agents. - Seamless collaboration.
This solution offers full compatibility with Slack, Jira, and other DevOps tools for streamlined incident response.
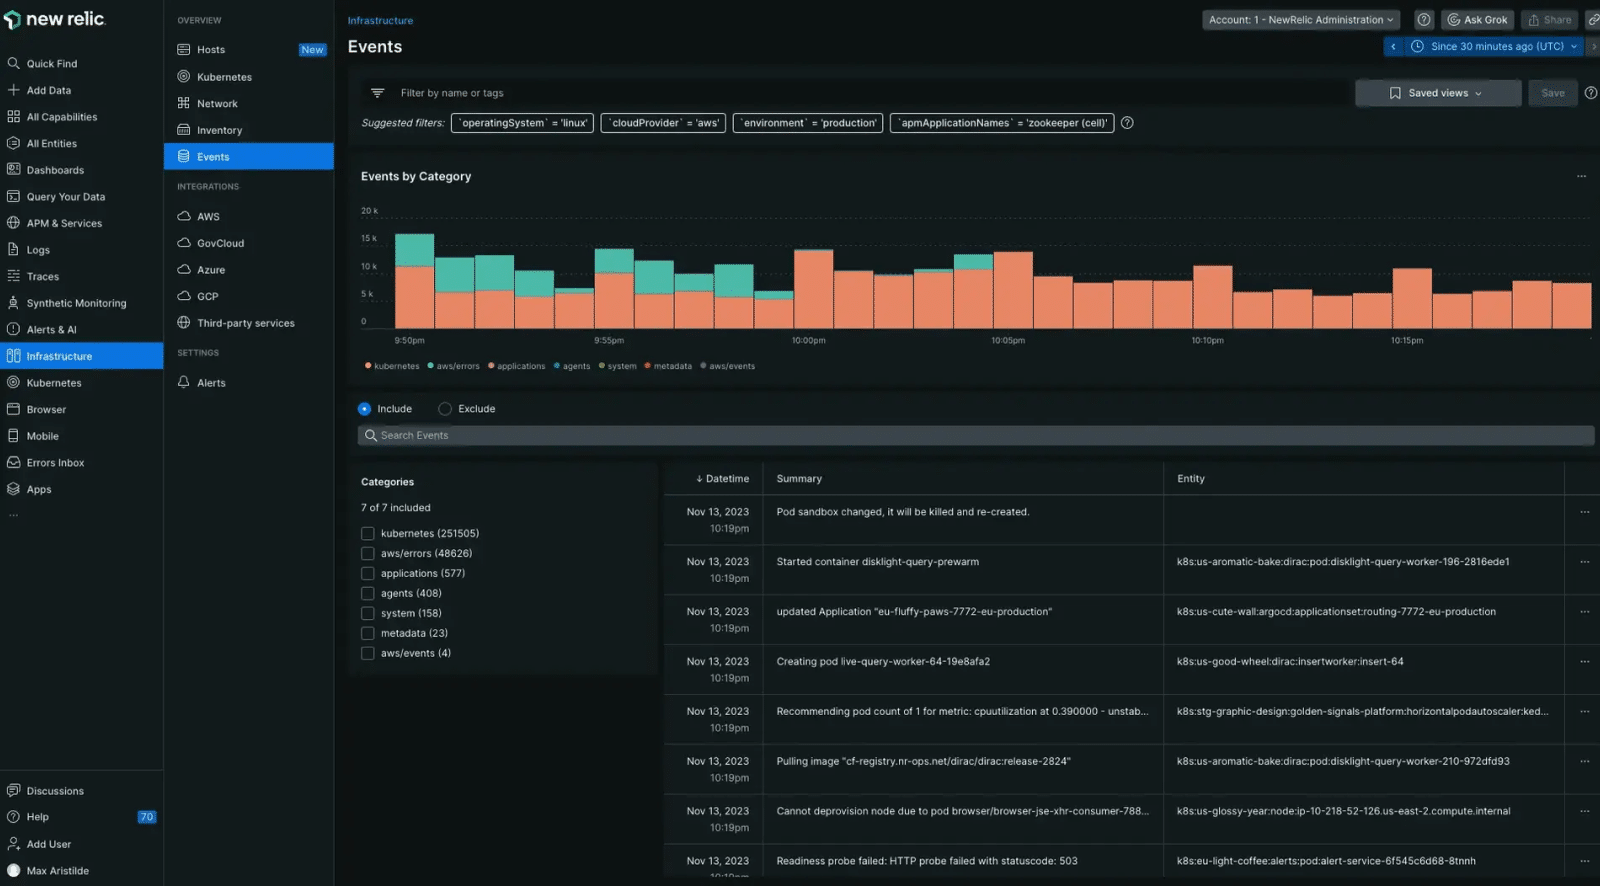
New Relic
New Relic is yet another cloud-native observability platform that enables real-time system health insights and fast issue resolution through infrastructure and application monitoring. Its numerous features allow teams to identify and visualize connections between infrastructure metrics and application performance, as well as other system components, and track live changes across their entire IT estate. The toolkit of New Relic includes AI-powered alerts, automated deployments, and dynamic dashboards, – features that make this solution a valuable asset in the matter of streamlining infrastructure monitoring and system performance optimization, particularly for cloud and hybrid environments.
New Relic is defined by several characteristics, specifically:
- Integrated infra and APM monitoring
- Automated change tracking
- Advanced Kubernetes monitoring
- Dynamic alerting and live-state tracking
- Filter sets for custom views
- Real-time searchable inventory
Here are the core advantages of New Relic:
- Faster troubleshooting.
New Relic is capable of quick root cause detection by correlating host and app performance. - Real-time insights.
Every five seconds, this tool collects and displays health metrics, thus providing near-instant visibility. - Cost-effective pricing.
When working with this tool, you pay strictly for the resources you utilize. - Seamless cloud and on-prem integration.
This tool is compatible with AWS, Azure, GCP, Kubernetes, Docker, and on-prem servers. - Scalability and automation.
New Relic supports auto-deployments with Ansible, Puppet, and Chef for rapid setup.
Key features of IT Infrastructure Monitoring Tools
What makes monitoring tools a crucial part of any IT infrastructure is their ability to provide you with the full view of your system’s performance, security, and compliance, while ensuring proactive issue detection, optimized resource utilization, and sensitive data protection. Beyond internal system benefits, these tools enable holistic observability that helps businesses meet regulatory requirements and reduce legal risks.
The benefits of modern monitoring tools are facilitated by the following characteristics, evident from the in-depth analysis of tools in the previous section:
- Real-time monitoring.
These tools are constantly supervising infrastructure performance to prevent issues in case anomalies are detected. - Alerting systems.
Notifications are sent accordingly to customizable thresholds, which allows teams to handle critical events promptly. - Dashboard and reporting.
Present-day monitoring tools visualize infrastructure health to make performance and trend analysis easier. - Historical data analysis.
Based on past system performance data, monitoring tools provide insights to identify patterns, optimize resource allocation, and prevent recurring issues.
How to choose the right IT Infrastructure Monitoring Tool
To choose a proper infrastructure monitoring tool, one had better thoroughly assess a range of pivotal factors, such as its ability to handle dynamic, scalable cloud environments, provide comprehensive observability, and support proactive analytics for infrastructure performance optimization. If you strike a balance among those aspects, the tool you have chosen will enhance visibility, reduce downtime, and ensure budget optimization. In this section, we will look into the key things to consider.
Assess Infrastructure Complexity
Given the dynamic environment of cloud-based infrastructures, the tools you select must capture real-time data, analyze dependencies between services, as well as handle transient workloads, such as rapidly scalable microservices and containers.
Ensure Comprehensive Monitoring
Choosing monitoring solutions that silo these components might lead to inefficiencies in your overall operational productivity. Instead, you should select tools that provide end-to-end visibility across computing, storage, and networking. A unified system simplifies the process of troubleshooting and optimization, as well as helps correlate performance metrics across cloud and on-prem environments.
Leverage Proactive Analytics and Automation
The optimal monitoring solutions are the ones that use machine learning, pattern recognition, and automation to detect anomalies and predict failures before they impact operations. Features like automated alerts, self-healing mechanisms, and AI-driven recommendations will significantly improve your system’s performance and reduce costs.
Evaluate Cost and ROI
Since monitoring tools are different in terms of price based on the number of monitored components (servers, virtual machines, or storage), you should consider conducting a thorough analysis to choose a tool that reduces downtime, enhances system efficiency, and optimizes resource allocation.
Consider Deployment Flexibility
An important aspect of a well-selected monitoring tool is its capability for seamless integration with multi-cloud and hybrid environments, on top of DevOps teams, workflows, security frameworks, and compliance policies. Besides, a proper tool should provide real-time dashboards and alerting systems that help teams handle critical issues promptly.
Frequently Asked Questions
With the help of IT infrastructure monitoring, teams can achieve a wide range of benefits, such as data-driven insights, proactive issue detection, minimized downtime, and optimized budgets. Ultimately, using infrastructure monitoring guarantees minimum disruptions, improved overall operational flow, and business productivity.
Generally speaking, IT infrastructure monitoring tools are designed to help track the health, performance, and security of IT systems. However, they come in various types that chiefly hinge on the object of monitoring, particularly:
- Network Monitoring. Tools track bandwidth, latency, and potential security threats to safeguard stable connectivity.
- Server Monitoring. In this case, monitoring tools supervise CPU, memory, and disk usage to prevent slowdowns or failures.
- Cloud and Hybrid Monitoring. Tools provide visibility into cloud resources, usage, and costs.
- Application Performance Monitoring (APM). Monitoring is used to identify slow response times and performance issues in applications.
- Log and Security Monitoring. Tools collect and analyze logs in order to enable troubleshooting and detect security threats.
- Kubernetes Monitoring. Lastly, monitoring tools are used to optimize the performance of containerized applications.
The choice depends entirely on your IT environment and business needs. So, with a user’s convenience in mind, many modern solutions provide multiple monitoring capabilities in one platform for better visibility.
Despite the numerous benefits brought by the implementation of infrastructure monitoring tools, the process of deployment might be difficult. Therefore, organizations must address such matters as setup complexity, customization, costs, and skill requirements to maximize effectiveness. Avoid such issues caused by implementation entails considering the following challenges:
- Complexity of Setup.
The integration of monitoring across hybrid and multi-cloud environments requires configuring multiple data sources to ensure compatibility and simplify log collection.
- Customization and Configuration.
Monitoring tools require personalized setups (dashboards, alerts, and automation rules) so as to prevent false positives and deliver useful insights.
- Cost Considerations.
The monitoring tool you choose must strike a balance between price and comprehensive monitoring since pricing is different based on monitored resources and data retention.
- Initial Investment vs. Long-Term Value.
Although the initial expenses for licensing and integration can be high, in the long run, this will result in reduced downtime and optimized resource usage.
- Training and Expertise.
IT teams must undergo training programs to gain skills in log analysis, alert management, and automation to leverage monitoring tools with maximum efficiency.
- Specialized Knowledge Requirements.
The more advanced the solutions, the more expertise is demanded in observability frameworks, cloud architectures, and predictive analytics to maximize automation and productivity.
As previously stated, a comprehensive infrastructure monitoring tool supervises system performance, availability, and security across various components, and ensures smooth operations as well as proactive issue resolution. Effective infrastructure management requires monitoring of the given areas:
- Servers and Compute Resources.
Metrics like CPU, memory, disk usage, and system uptime must be tracked to prevent resource bottlenecks and guarantee performance stability.</li>
- Network Performance.
Monitoring network indicators – bandwidth utilization, latency, packet loss, and connection failures – is essential for optimizing data flow and detecting anomalies.
- Storage and Databases.
To proactively maintain efficiency and prevent downtime, monitoring indicators such as disk space, IOPS, query performance, and replication status matter a lot.
- Cloud and Virtual Environments.
Resource scaling, cost usage, and API response times – these metrics are highly important to maintain dynamic workloads and cloud-native applications.
- Applications and Services.
When it comes to application reliability and performance, indicators like response times, error rates, and user experience metrics are used to diagnose performance issues.
- Security and Compliance.
Violations, like unauthorized access, failed login attempts, security policy breaches, and audit logs must be monitored to detect potential threats and maintain compliance.